
Make Professional Pie Chart With a Few Clicks
Name your labels, enter your values, select a color, or choose from beautiful color palettes, and your pie chart is ready. Start from one of the pie chart templates, or switch the style to make a 3D pie chart.
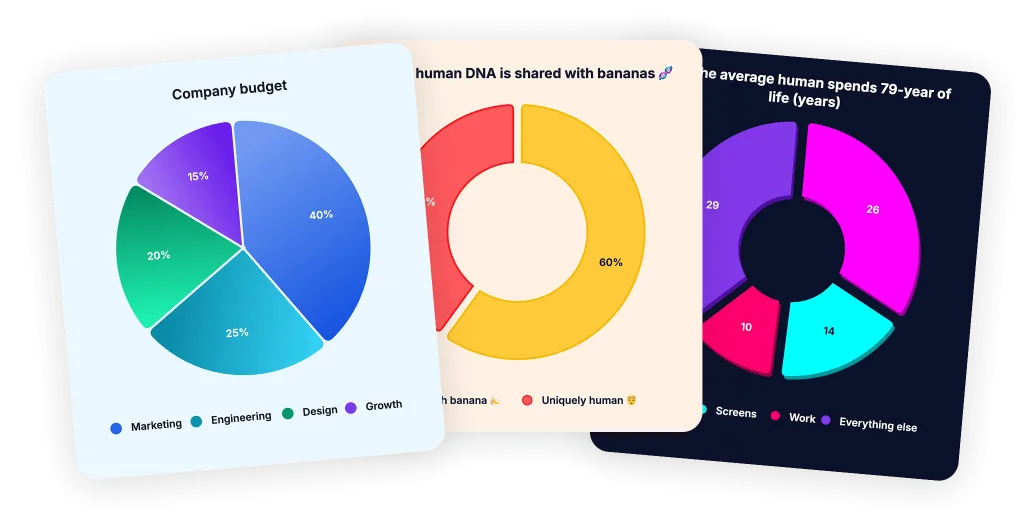
Level-up Your Presentations with Pie Chart Maker
Pick colors that match your slides and download a PNG with a transparent background, so the chart sits cleanly on any slide color. Percentage labels go right on the slices.
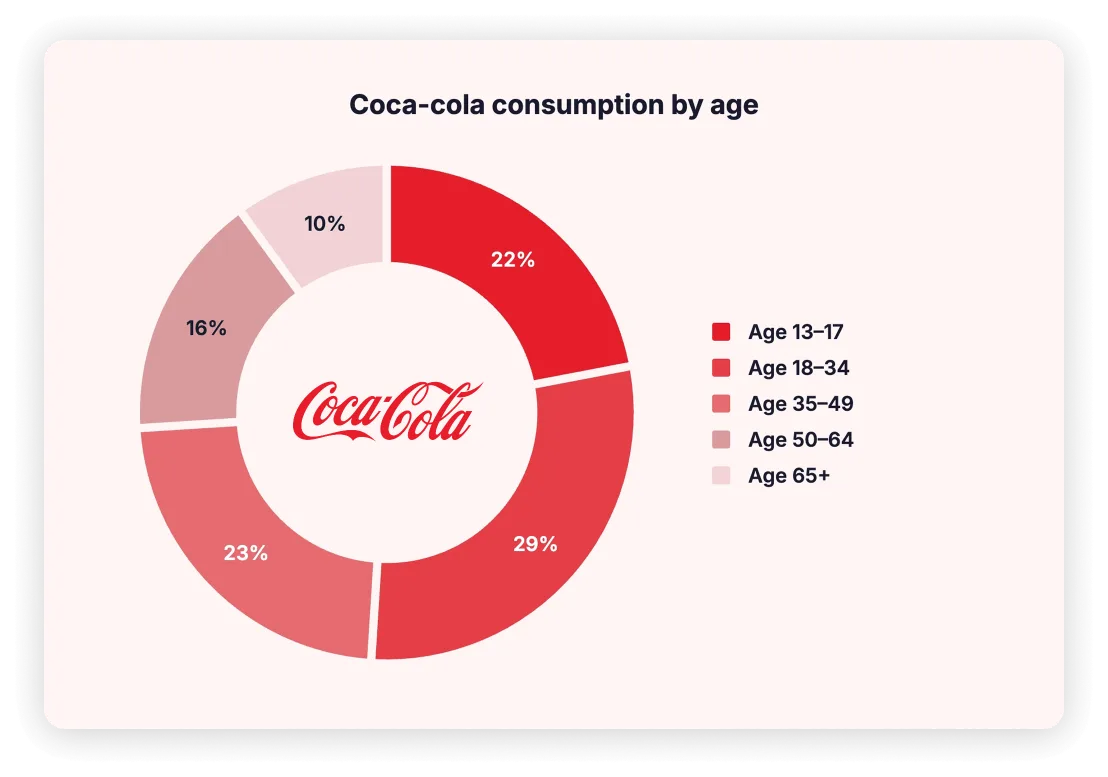
Features of Online Pie Chart Maker
-
Values and percentages
Choose between absolute values and percentages
-
.png, .jpeg, .svg
All major formats ready for download, great for sharing
-
Full design customization
Change colors, styles and background to fit your brand
-
CC0 license
All you make here is free to use under CC0 licence
-
Left, center, right
Align the chart the way it fits your presentation the most
-
Embed
Embed the pie chart to your website, blog or article
More chart makers
- Donut chart makerPie charts with a hole, from thick to thin
- 3D pie chart makerTilted 3D pies and 3D donuts
- Pie chart with percentagesRaw numbers in, percentages on the slices
- Circle graph makerFor school, with percent and degrees worked out
- Pie chart templates10 ready-made charts to edit
- Scatter plot makerTwo columns in, line of best fit and R² out
- Line graph makerDates on the x-axis, notes on the points
- Venn diagram makerPaste two lists, get the overlap
FAQ
What is a pie chart maker?
A pie chart maker (also called a pie chart generator or pie chart creator) is an online tool that converts your data into a pie graph, a circular chart divided into proportional slices. Each slice shows a category's share of the whole, making it easy to visualize percentages at a glance. Instead of building a circle graph manually in a spreadsheet, you enter your values and get a finished chart in seconds.
How do I make a pie chart with this tool?
Enter your category labels and numeric values, and the pie chart maker does the rest. It calculates proportions, sizes each slice, and renders a clean pie graph you can customize. Add a title, pick colors and a style, and download. The whole process takes under a minute.
Is this pie chart maker free?
Yes, completely free. No credit card, no trial period, no watermarks. You can create and download unlimited pie charts and pie graphs at no cost.
Do I need to create an account?
No. There are no accounts at all. Your chart is saved in your browser, so it's still there when you come back on the same device.
Can I make a pie chart with percentages?
Yes. Type percentages directly, or type raw values and set "Show on chart" to %, and the pie chart generator works out each slice's share for you. More on this, including why labels can add up to 99.9%, on the pie chart maker with percentages page.
What's the ideal number of slices for a pie chart?
Stick to 2–7 slices. Beyond seven, the circle graph becomes hard to read because slices get too thin to distinguish. If you have more categories, group the smallest into an "Other" slice, or switch to bars with the Line | Bar switch in the line graph maker.
What's the difference between a pie chart and a donut chart?
A donut chart is a pie chart with a hollow center, it shows the same part-to-whole relationship but frees up space for a total, label, or icon in the middle. Drag the Hole Size slider to turn any pie into a donut. The donut chart maker page shows how hole size changes the look.
Can I customize colors, labels, and styles?
Yes. Change each slice's color, edit the labels, pick one of 8 styles (3D included) and 15 color palettes, set the background color, and place the legend below, left or right of the chart.